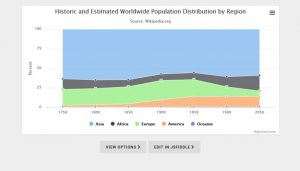
Data visualisation is very useful not only for making a chart for the story, but also for discovering patterns in your data that give you clues about what’s really going on. Here you can find some resources that go from simple to complex.
Infogram is an easy to use Infographic and Chart Maker. Create and share beautiful infographics, online charts and interactive maps. Make your own here.
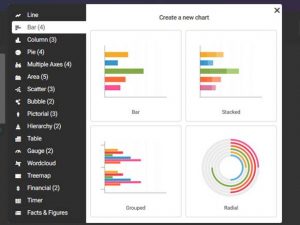
Tutorial: https://www.youtube.com/watch?v=vVYahWlFT9U
Datawrapper: Charts and maps. You can feed Datawrapper with any data from Excel, CSVs, PDFs or the web. Datawrapper graphs can be embedded into any website or CMS with ready-to-use embed codes.
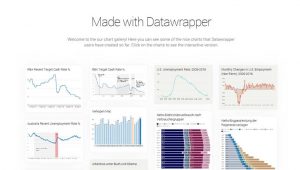
Tutorial: https://www.youtube.com/watch?v=7sj09cVjQJ4
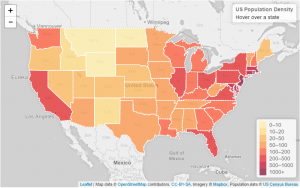
Carto: Users can manage data, run user side analysis and design custom maps. In the builder, advanced users also have access a web interface where SQL can be used to manipulate data and CartoCSS.
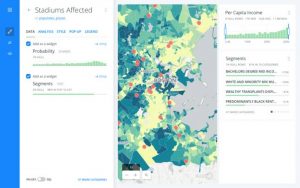
Tutorial: https://www.youtube.com/user/CartoDB
Tableau: Interactive charts and maps. Is a visual analytics tool (software) that can give you quick insights into your data. It technology lets users drag-and-drop data for analysis, following their own fluid train of thought to quickly create dynamic visuals.
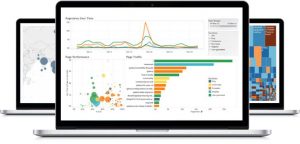
Tutorial: https://www.youtube.com/watch?v=6BWPoccQat
Highcharts.js: a javascript library for making interactive charts in the web. You can copy the prototypes and insert your data into them.
Tutorial: https://www.youtube.com/watch?v=u_WIv9Ll6eI
Leaflet.js: The Javascript open library which is behind Carto. It enables to import a layer for your map and insert data in geojson files. The possibilities are in fact endless.
Leave a Reply